Optimiser GUI Description
The following describes the elements of the Optimiser GUI.
In this topic:
Circuit Definition
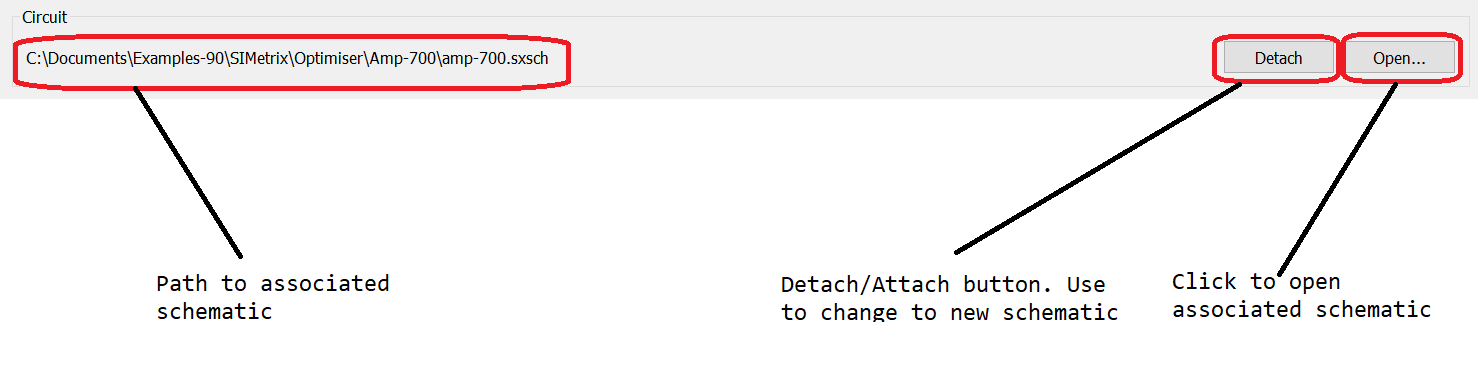
The circuit definition section is where the associated schematic may be defined and opened. The optimiser GUI works on a single schematic. The GUI defines the analyses to be run overriding any definitions in the schematic itself.
Optimiser Options
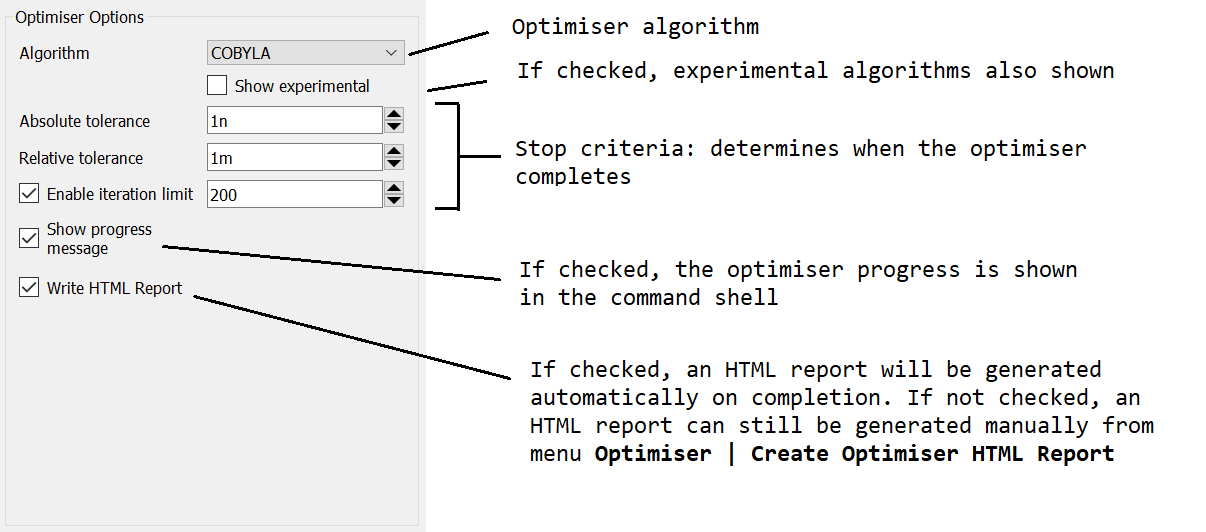
| Algorithm | Choose the algorithm. For unconstrained definitions, use NELDER_MEAD. For constrained problems use COBYLA |
| Show progress message | If checked, the progress of the optimiser will be displayed in the command shell. The values of the parameters along with the measurements is displayed for each iteration |
| Write HTML Report | If checked, an HTML report will be generated and displayed upon completion |
| Absolute tolerance | Stop criteria. Absolute value used to determine when no further improvement is possible |
| Relative tolerance | Stop criteria. Relative value used to determine when no further improvement is possible |
| Iteration limit | If enabled, the optimiser will complete when the specified number of iterations is reached |
Parameters
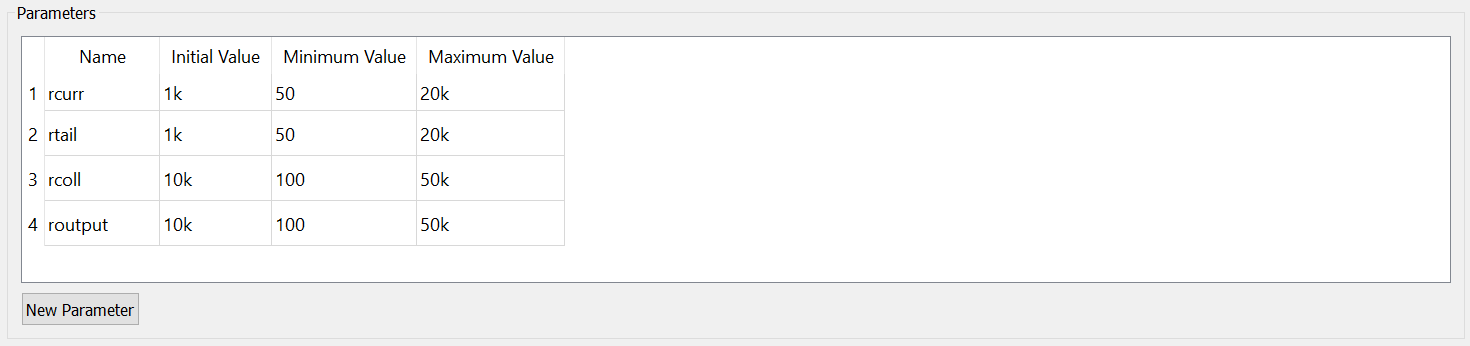
Defines the parameters to be varied during the optimisation process. The parameters are variables that may be used to define any component or model parameter in the same way as .PARAM values in SIMetrix simulations and .VAR values in SIMPLIS simulations. You must at the minimum define an initial value for each parameter. The minimum and maximum values are optional. If specified the optimiser will not attempt values outside the minimum and maximum range.
Click on the New Parameter button to create a new parameter. To delete an existing parameter, select the parameter row then press the Delete button.
Specification View - Table
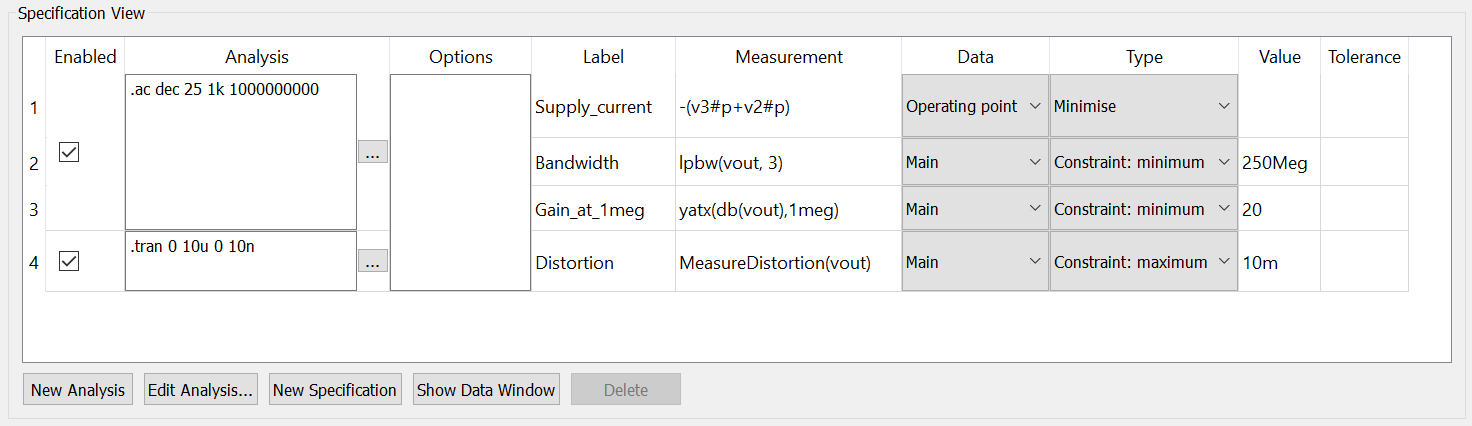
The specification view is where the analyses and measurements are defined. There may be one or more analyses defined and each analysis may have zero or more associated measurements. One and only one of the measurements must be defined as the objective function, defined as either Minimise or Maximise. This is the quantity that the optimiser will seek to minimise or maximise. Other measurements may be constraints, which the optimiser will seek to satisfy but will not maximise or minimise beyond meeting the constraint value. There may be any number of constraints.
| Enabled | If unchecked, the specified analysis will not be run and its measurements will not be evaluated. This has the same effect of deleting the analysis altogether | ||||||||||||
| Analysis | Analysis definition in the form of the netlist line starting with a '.'. For SIMetrix simulations you can click on edit button to invoke the choose analysis GUI to define each analysis. For SIMPLIS simulations click on the Edit Analysis... button to invoke the choose analysis GUI. The Edit Analysis... may also be used for SIMetrix simulations but note that this method is limited to one analysis of each type (AC, DC etc). The edit analysis button in the table can be used to define any number of analyses including multiple analyses of the same type. (E.g. multiple noise analyses referring to different nodes) | ||||||||||||
| Options | Simulation options may be defined here. The Choose analysis GUI will also edit this entry | ||||||||||||
| Label | Each measurement should have a label which is used to reference it in messages and the final report | ||||||||||||
| Measurement | Expression that returns a scalar value for the analysis type. This is similar to goal functions used for Monte Carlo histograms and performance analysis | ||||||||||||
| Data | This column is hidden in SIMPLIS mode. Defines whether the measurement is to be applied to the main analysis or its operating point. Note that the operating point data is always scalar | ||||||||||||
| Type |
|
||||||||||||
| Value | For constraints this is the minimum or maximum value that must be attained. A value may also be specified for an objective function but is not compulsory. If specified, it will be treated as a stop value and the optimiser will complete if the value is reached with all constraints met. This makes an objective function similar to a constraint but it is not identical. The value given to an objective function only sets criteria for stopping the optimisation but otherwise is ignored by the optimiser algorithm. Constraint values on the other hand take part in the mathematics of the optimiser algorithm and will affect the path taken by the optimiser | ||||||||||||
| Tolerance | Constraint functions may specify a tolerance but this is not compulsory. This value affects only the final report and the determination of the best result. The tolerance value does not play a part in the optimisation process. The optimiser will often locate results which violate a given constraint but only by a small margin. Such results would be marked as violating the constraint in the final report and would be excluded in the test to identify the best result. By providing a small tolerance, fewer useful results will be unnecessarily discarded. The tolerance value is an absolute value and should always be positive. |
Using Parameters in Measurements
The value of any parameter defined in the parameter view may also be accessed in measurement expressions. Simply use the parameter name as a variable. This makes it possible to enter expressions that define some quantity not directly obtained from simulation, such as component monetary cost, volume or mass. Note that if there is a name clash with a simulation vector, the simulation vector takes priority.
Specification View - Buttons
| New Analysis | Creates a new analysis row |
| Edit Analysis | Calls up GUI to edit SIMetrix or SIMPLIS analyses |
| New Specification | Adds a new measurement to the selected analysis |
| Show/Hide Data Window | Shows or hides the data window. The data window shows data items that can be used to store vector information. It is particularly useful for curve fitting applications |
| Delete | Deletes the item specified. When enabled the delete button will identify which item will be deleted when you click on it. This will either be a measurement or a complete analysis depending on what is selected in the table. You can also press the Delete key to delete an item |
Data View
The Data View is used to store data items which can be used for any purpose especially curve fitting. Data may entered from a text file or extracted from a curve using the graphical extraction tool. The resulting data can be referenced as a single variable in any measurement. Note that data objects are currently only supported by SIMetrix simulations.
Data View - Creating a Data Object
To create a data object you must have a source file. This may be either
- A text file containing X-Y data in columns. For example:\\ 0.2000000000000000111022 0.0175307167242359750181 \\ 0.2274509803921568595886 0.025024031800198024561 \\ 0.2549019607843137080749 0.0357202832826342478456 \\ 0.2823529411764705843169 0.050988531663452428544 \\ 0.3098039215686274605588 0.0727830275203565219 \\ 0.3372549019607843368007 0.1038933446837419644071 \\ 0.3647058823529412130426 0.1482772943030602474934 \\ 0.3921568627450980892846 0.2112407791158169012569
- OR \\ A graphical image of a graph which can be digitised. For example, you may have a data sheet of a component whose behaviour you wish to model.
Creating a Data Object from a Text File
The data file must be an ASCII file containing two columns of data separated by spaces or tabs. The first line may contain a text header but this is not compulsory. To import a text file:
- Click on the Load Data... button
- Navigate to the data file
- Click on Open. A data object will be created with a default name
- If desired, rename the data object by clicking on its name. The name must not contain white space and preferably should only contain letters, numbers and the underscore character
Creating a Data Object from a Graphical Image
To create data from a graphical image, click on the Extract Data... button. For full instructions to use this feature see Digitising Data Sheet Curves
When complete, the data will be imported and given a default name. You can change the name as desired but note that the name must not contain white space and preferably should only contain letters, numbers and the underscore character.
Measurement Functions
Measurement functions have the same requirements as goal functions used for Histogram generation and Performance Analysis. For details of available functions, refer to Goal Functions
| ◄ Running Curve Fitting Example (SIMetrix) | Optimiser Algorithms ▶ |