Analysing Sensitivity and Worst-case Results
In this topic:
Plots
Plots of sensitivity and worst-case analyses are performed in exactly the same manner as for normal runs. When you probe a circuit point, curves for each run in the analysis will be created. For multi-step sensitivity analysis, there will be one curve for each sensitivity case. For multi-step worst case analysis, there will be two curves for each sensitivity measurement function provided. One curve maximises the sensitivity function and the other minimise the sensitivity function.
In common with other multi-step analyses, the curves generated are grouped and operations performed on them treat the group as a single entity. You can break the group using menu .
Reports
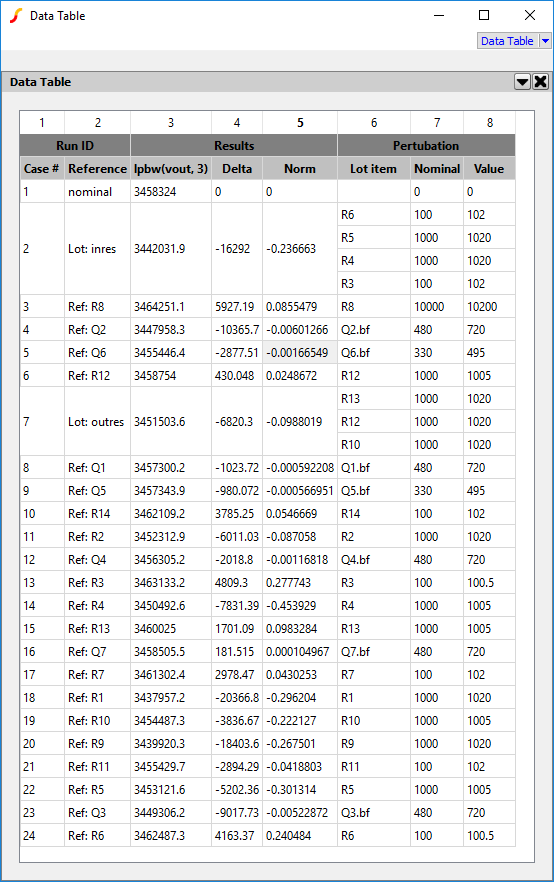
Sensitivity Analysis Interactive Table
The sensitivity analysis interactive table may be opened using menu . This will show something like this:
Double-clicking the headings will sort the values in order of magnitude or alphabetically in the case of the Reference column. Sorting is inactive for the Perturbation columns.
The report provides the results of evaluating the sensitivity measurement functions along with perturbation data. In the example above there are 8 columns, made up of 2 columns identifying the case, 3 columns for perturbation data and 3 columns for measurement function data. In general there will always be 5 columns plus 3 for each measurement function supplied. The following table explains the purpose of each column:
| Case # | Case number. This can also be read as a cursor readout from the graph allowing cross-referencing between the graph and the this report |
| Reference | A label identifying exactly what was perturbed in this case. This may be a single component value but may also be a model parameter (e.g. case 4) or a group of matched items referenced by their lot name (e.g. case 2 and 7) |
| Measurement function | The actual column heading will be the expression used. This is the result of evaluating the given sensitivity measurement function |
| Delta | The difference between the measurement function value for this case and that obtained from the nominal case. Double clicking the header will sort the table according to the magnitude of the value in this column |
| Norm | Normalised sensitivity A value that indicates the sensitivity of the item being perturbed to the measurement result, independent of the level of perturbation. The value is calculated from Delta/measurement * nominal-value/perturbation. This value can be used to identify components that are unduly sensitive and which could indicate a design flaw. Note that this value does not have much meaning for measurement results that are nominally zero such as the offset of a differential amplifier. Double clicking the header will sort the table according to the magnitude of the value in this column |
| Lot item | Single item being perturbed. This may be the same as the reference column if only a single item is being perturbed in the case. But if there are items grouped together in a lot, each item will be listed. In case 2 in the example above, there are 4 resistors perturbed together as these are 4 matched devices in a network. |
| Nominal | Nominal value of single item being perturbed |
| Value | Actual value used in this case |
Sensitivity Analysis HTML Report
The menu will create and display a sensitivity HTML report. This shows the same information as the interactive table but its sort order is fixed. The HTML file is created by this process and will be available in the current working directory with the name of sensitivity.html.
The styles used for the HTML file are defined in a .CSS file. You can specify your own if desired. See File Location Options.
Worst-case Analysis Report
The sensitivity analysis report may be opened using menu .
This shows the values used for each worst-case analysis as well as the results of calculating the sensitivity measurement functions.
The styles used for the HTML file are defined in a .CSS file. You can specify your own if desired. See File Location Options.
| ◄ Analysing Monte-Carlo Results | Introduction ▶ |