Line Impedance Stabilization Network (LISN)
A Line Impedance Stabilization Network (LISN) is a device placed between equipment under test (e.g. a power supply, or a larger system containing a power supply), and an AC or DC power source to create a known precise impedance to the power input of the equipment under test (EUT) and to provide a port for measuring electromagnetic interference (EMI). In addition to the actual LCR stabilization network, the LISN device available in SIMPLIS also includes embedded voltage and Fourier probes that measure differential mode (DM), common mode (CM), and total conducted EMI. Additionally, the LISN device can be configured to plot emission limits defined by different EMI emission standards on the same graph as the measured conducted EMI. This allows for the quick testing of whether the EUT (i.e. the converter circuit in the schematic) meets the required conducted EMI specifications.
In this topic:
| Model Name: | Line Impedance Stabilization Network | |
| Simulator: |
|
This device is compatible with the SIMPLIS simulator |
| Parts Selector Menu Location: | ||
| Symbol Library: | simplis_analog_functions.sxslb | |
| Model File: | simplis_analog_functions.lb | |
| Symbol Name: | LISN | |
| Subcircuit Name: | LISN | |
| Symbol: | 
|
|
| Multiple Selections: | Only one device at a time can be edited. | |
LISN Circuit and Measurement Type
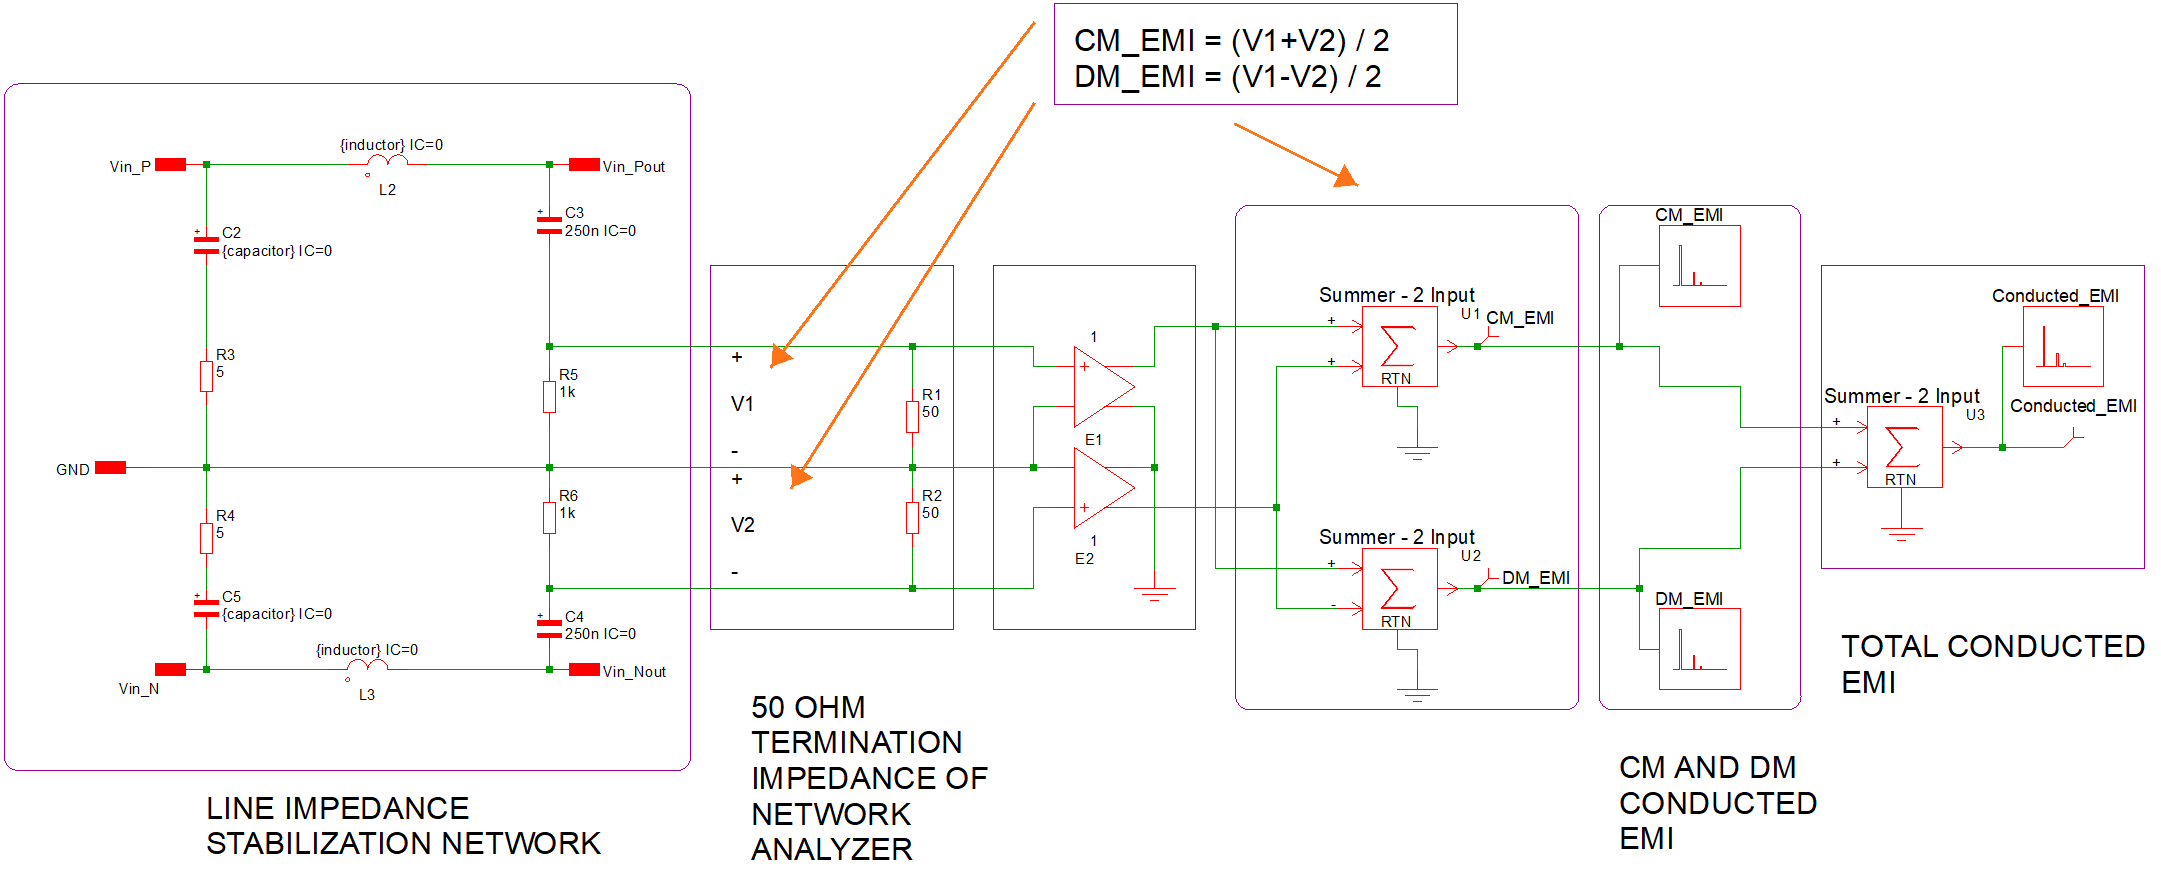
The schematic of the LISN device is shown above. The inductance applied to inductors L2 and L3 and the capacitance applied to capacitors C2 and C5 can be selected or specified by the user. The remaining circuit values are fixed and cannot be modified. The SIMPLIS LISN device models a standard V-LISN, which is by far the most common LISN used in practice, and also models the 50 Ω termination of a network analyzer that would be used to measure EMI.
In an actual measurement setup, the EMI detector can make three types of measurements: peak, quasi-peak, and average.
In the SIMPLIS LISN device, voltages V1 across resistor R5 and V2 across resistor R6 are measured. As shown above, the common mode EMI, labelled as CM_EMI, is equal to half the sum of these two measured voltages, and the differential mode EMI, labelled as DM_EMI, is equal to half the difference of these two measured voltages. The sum of CM_EMI and DM_EMI, equivalent to V1, is the Total Conducted EMI. These three signals - CM_EMI, DM_EMI, and Total Conducted EMI - are fed into FFT Probes which are configured to display the noise spectrum in dBµV vs. frequency. The FFT is performed over the full range of the time-domain simulation data without any processing of the measured voltages. In most cases, the FFT of the noise is, in terms of magnitude, slightly below the average noise measurement of an EMI detector. It is the responsibility of the user to properly set the simulation time in order to get valid noise mesurements.
By default, after a simulation, the LISN will create six waveforms: the CM, DM, and total conducted EMI as voltage measurements over time, and as a frequency spectrum plot in dBµV.
In addition, it possible to configure the LISN to produce the peak, quasi-peak, and/or average measurements similar to an EMI detector. The SIMPLIS LISN device does not model the circuitry of an EMI detector during the simulation of the schematic. Instead, the equivalent of EMI detector measurements are calculated in a post-processing step after the simulation is complete. Note that the computation of these measurements, especially of the quasi-peak, may be time-consuming. If any of these measurements are specified to be done, the Total Conducted EMI waveform will be processed after the simulation and the results, in dBµV, will be displayed on the same plot as the FFT results. Therefore, optionally an additional three waveforms can be created by the LISN, for a maximum total of nine.
Editing the LISN
To configure the LISN, follow these steps:
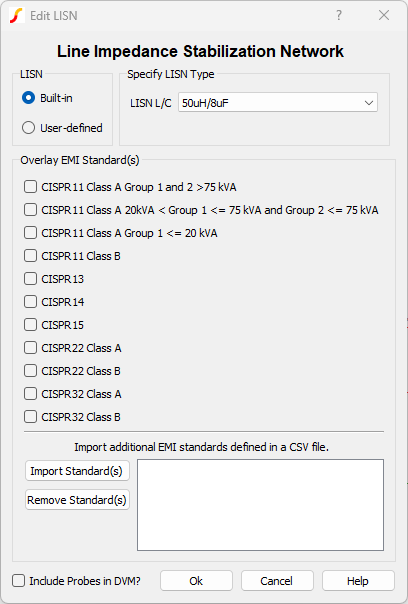
- Double click the symbol on the schematic to open the editing dialog.
- Select either a Built-in or User-defined LISN.
- Set the inductor and capacitor values.
- Optional: Select standards to overlay on the total conducted EMI plot.
- Optional: Select EMI test receiver measurements to calculate after the simulation is complete.
Built-in
- 50 μH inductor / 8 μF capacitor - this type of LISN is used primarily to test equipment that will be installed in household or industrial environments. It mimics 50 metres of wiring inside of a building.
- 5 μH inductor / 1 μF capacitor - this type of LISN is used primarily to test equipment that will be installed in vehicles. It mimics the length of 5 metres of wiring inside of a vehicle, e.g. a wiring harness.
It is important to select the type of LISN appropriate to the application and to the standards that the circuit needs to meet. The two built-in LISN configurations given above will be suitable for the vast majority of applications. When that is not the case, the User-defined LISN should be used (see section below).
| Parameter Label | Units | Description |
| LISN L/C | Inductor/Capacitance values used in the LISN. Built-in options are 50 μH / 8 μF and 5 μH / 1 μF. |
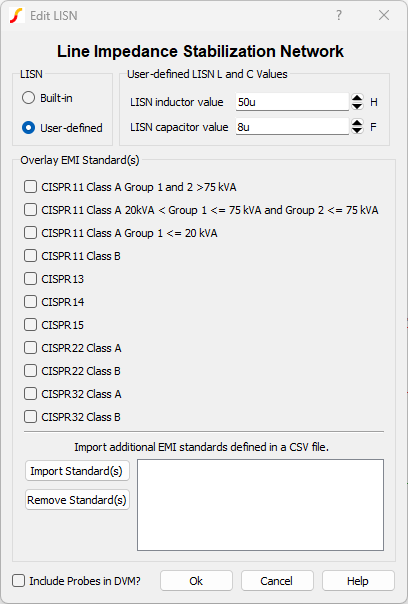
User-defined
It is of great importance that the inductance and capacitance values used in the LISN reflect the specifications which the EUT needs to meet. In some cases, it may be that the Built-in LISN types provided above are not appropriate to the application at hand. In those cases, the User-defined model allows the selection of any inductor and capacitor values:
| Parameter Label | Units | Description |
| LISN inductor value | H | The inductor value used in the LISN |
| LISN capacitor value | F | The capacitor value used in the LISN |
EMI Standards
EMI standards can be selected and overlayed atop of the Total Conducted EMI waveform. Several common standards are already available built-in, and one or more can be selected for overlay by checking the box next to the standard's name. The list of standards available by default is not exhaustive, and new EMI standards are continuously being developed. Therefore the user can define additional standards for overlay as explained below. Each standard defines the limits for allowed conducted EMI in dBµV for a given set of frequency ranges for the applications that the standard is designed for. If selected, the standard appears on the Total Conducted EMI plot as a series of straight lines, and it can be easily concluded whether the total measured conducted EMI exceeds the limits set by the standard (and by how much) or not.
Most EMI standards define emission limits for quasi-peak and average measurements. Some standards include limits for peak measurements, but this is rarer. As noted above, the SIMPLIS LISN device provides an FFT of the measured noise, which is usually below the average noise measured by an EMI detector. Therefore the built-in EMI standards all show average limits. These can be compared against the FFT, and against the optionally available average measurements of the LISN. However if peak or quasi-peak measurements are selected, then a comparison to the built-in standards is not relevant. In those cases, additional standards that specify peak or quasi-peak limits respectively should be added, as explained below.
Additional standards may be stored in a Comma-Separated Values (CSV) file and imported in to the dialog. These standards should contain average limits. The format of the CSV file is shown below:
| *Pretty Name | Property Name | X0 | Y0 | X1 | Y1 | Xn,Yn... |
|---|---|---|---|---|---|---|
| EMI Standard ABC | standard_abc | ABC X0 value | ABC Y0 value | ABC X1 value | ABC Y1 value | ... |
| EMI Standard XYZ | standard_xyz | XYZ X0 value | XYZ Y0 value | XYZ X1 value | XYZ Y1 value | ... |
- It must have a Pretty Name, which can have spaces.
- It must have a Property Name that is unique from any other standard. This includes the standards that come pre-loaded with the program.
- The XY data must be in the format of X0,Y0,X1,Y1,X2,Y2,…,Xn,Yn and can be as long as necessary.
- The X data should be frequency in Hz and the Y data should be a noise limit in dBµV.
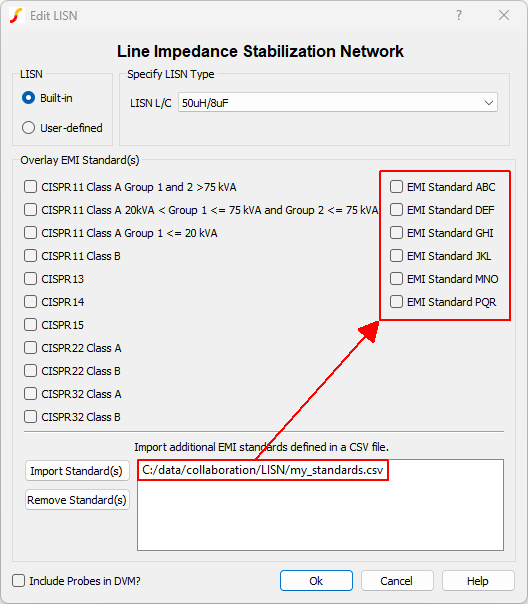
To remove any imported files, select them and press the Remove Standard(s) button. The standards contained in the selected file will be removed from the list.
LISN in DVM
Selecting the Include Probes in DVM? checkbox will prepend "DVM" to all probes located in the LISN.
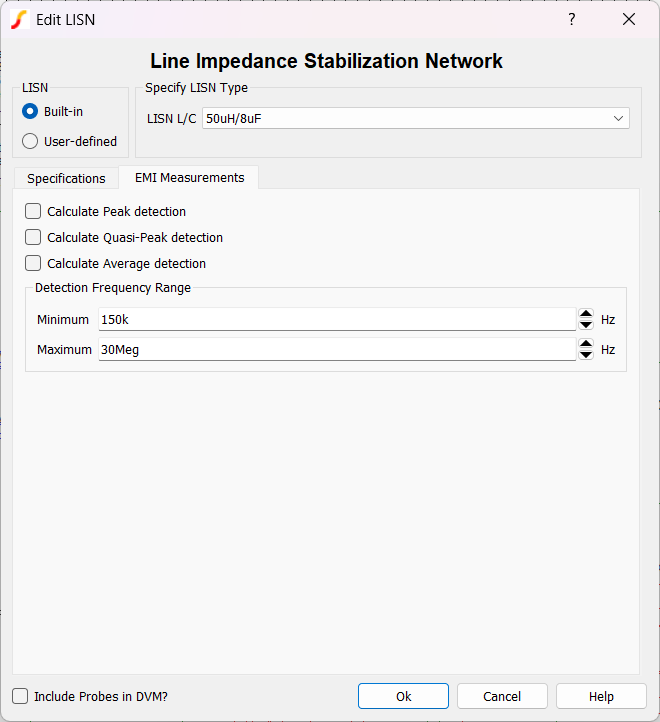
EMI Measurements
By default, the LISN only performs the FFT on the total conducted EMI voltage waveform. In the EMI Measurements tab, the LISN can be configured to perform the peak, quasi-peak, and/or average noise detection similar to a real EMI test detector. One, two, or all three of these EMI measurements can be selected by means of a checkbox. If any of these measurements is specified, after the simulation is complete, the total conducted EMI voltage waveform will be processed to calculate the selected measurements. A progress window will appear after the simulation, indicating that calculation is under way. Depending on the length and resolution of the waveform, this may take a significant amount of time.
After the calculations are complete, the specified measurement curves will be plotted on the same graph as the FFT results, allowing comparison with overlaid EMI standards (if any have been selected). The EMI measurements are performed according to the specifications in the CISPR16.1 standard. Therefore for a well-constructed model, the simulation will provide similar results to a realistic EMI test, showing whether the circuit meets EMI standard specifications.
It is possible to specify the frequency range over which the EMI measurement calculations are to be performed. The default is 150 kHz - 30 MHz. If the frequency range of interest is shorter, it is recommended to reduce it in the settings accordingly, in order to reduce computation time.
| Parameter Label | Units | Description |
| Minimum | Hz | The frequency at which the EMI measurement calculation starts |
| Maximum | Hz | The frequency at which the EMI measurement calculation ends |
Examples
Below are two examples which demonstrate usage of the LISN.
AC/DC Example: PFC with EMI Filter and LISN
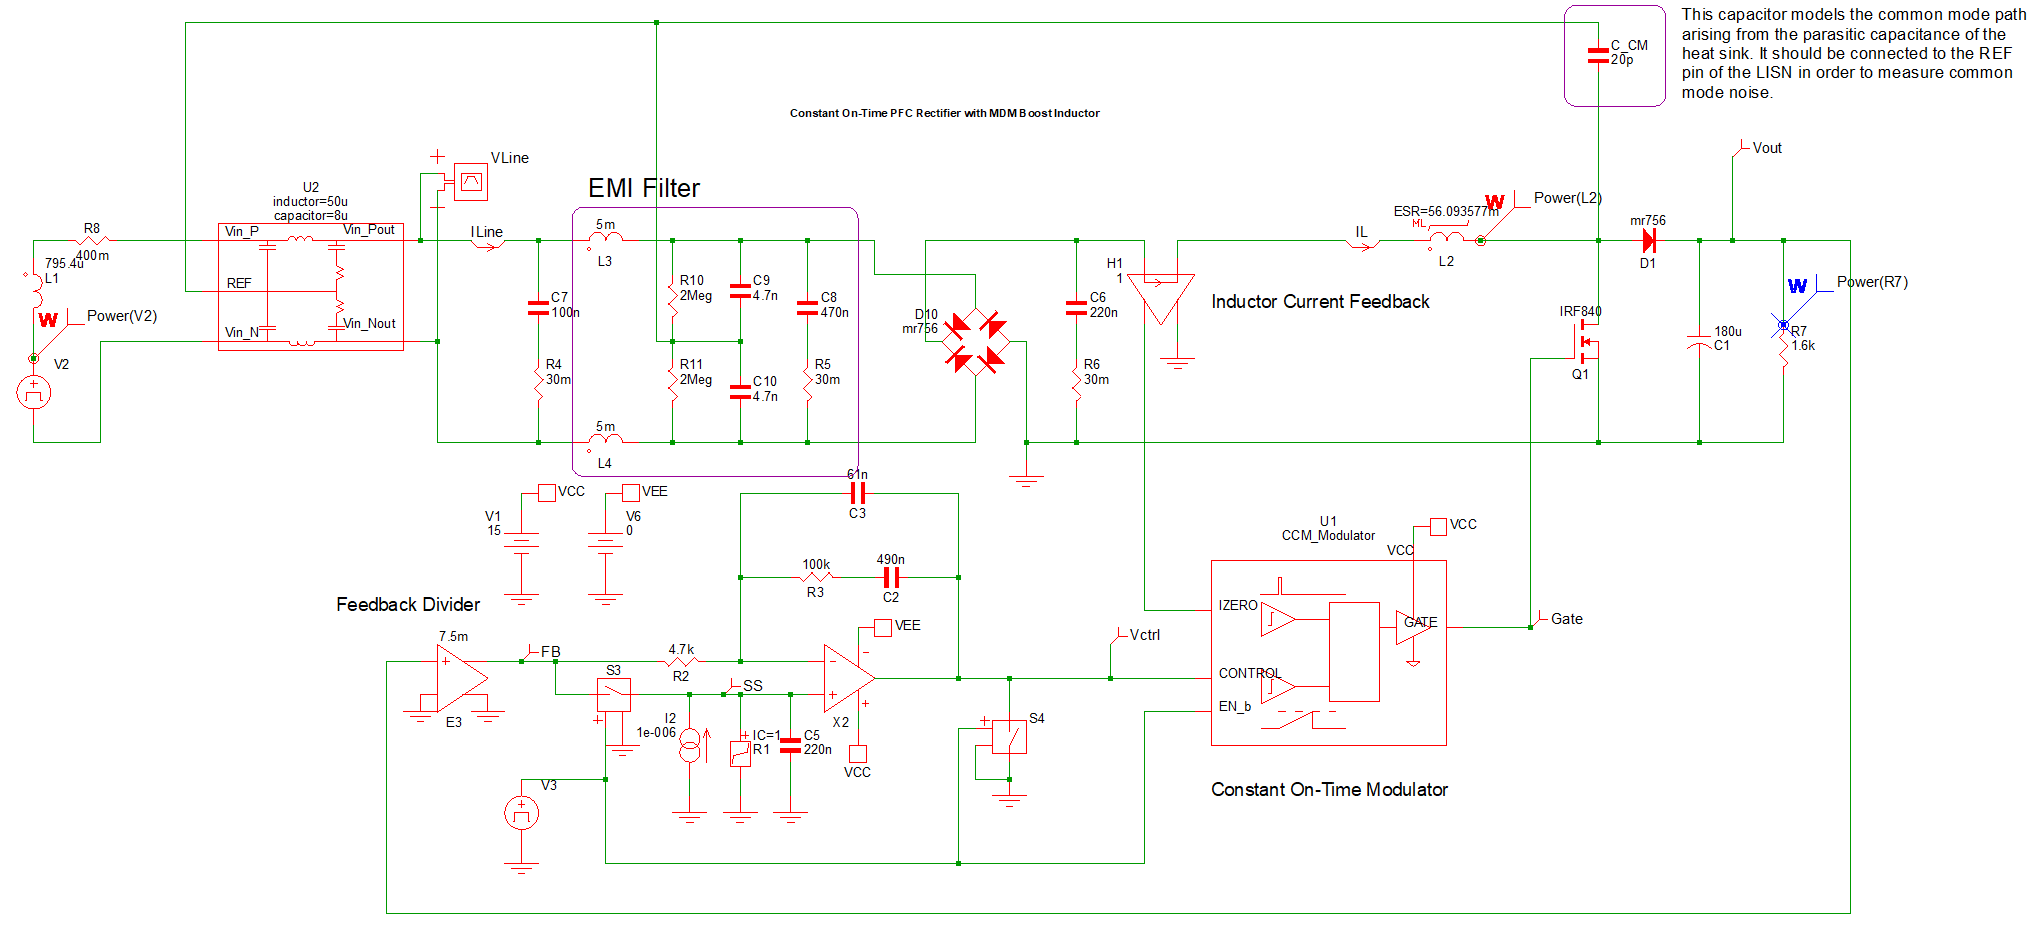
A PFC rectifier with AC line input, a LISN, and an EMI filter is provided in the schematic simplis_085_lisn_mdm_pfc_boost_inductor.zip. As the rectifier is connected to the AC mains, the LISN is configured to have a 50 µH inductor, and to show measured conducted EMI compared against the built-in CISPR32 Class B standard for consumer electronics. The schematic is configured to run a transient simulation.
Waveforms
If the EMI filter is disabled or removed, the LISN will show that the conducted EMI exceeds the limits set by the CISPR32 standard:
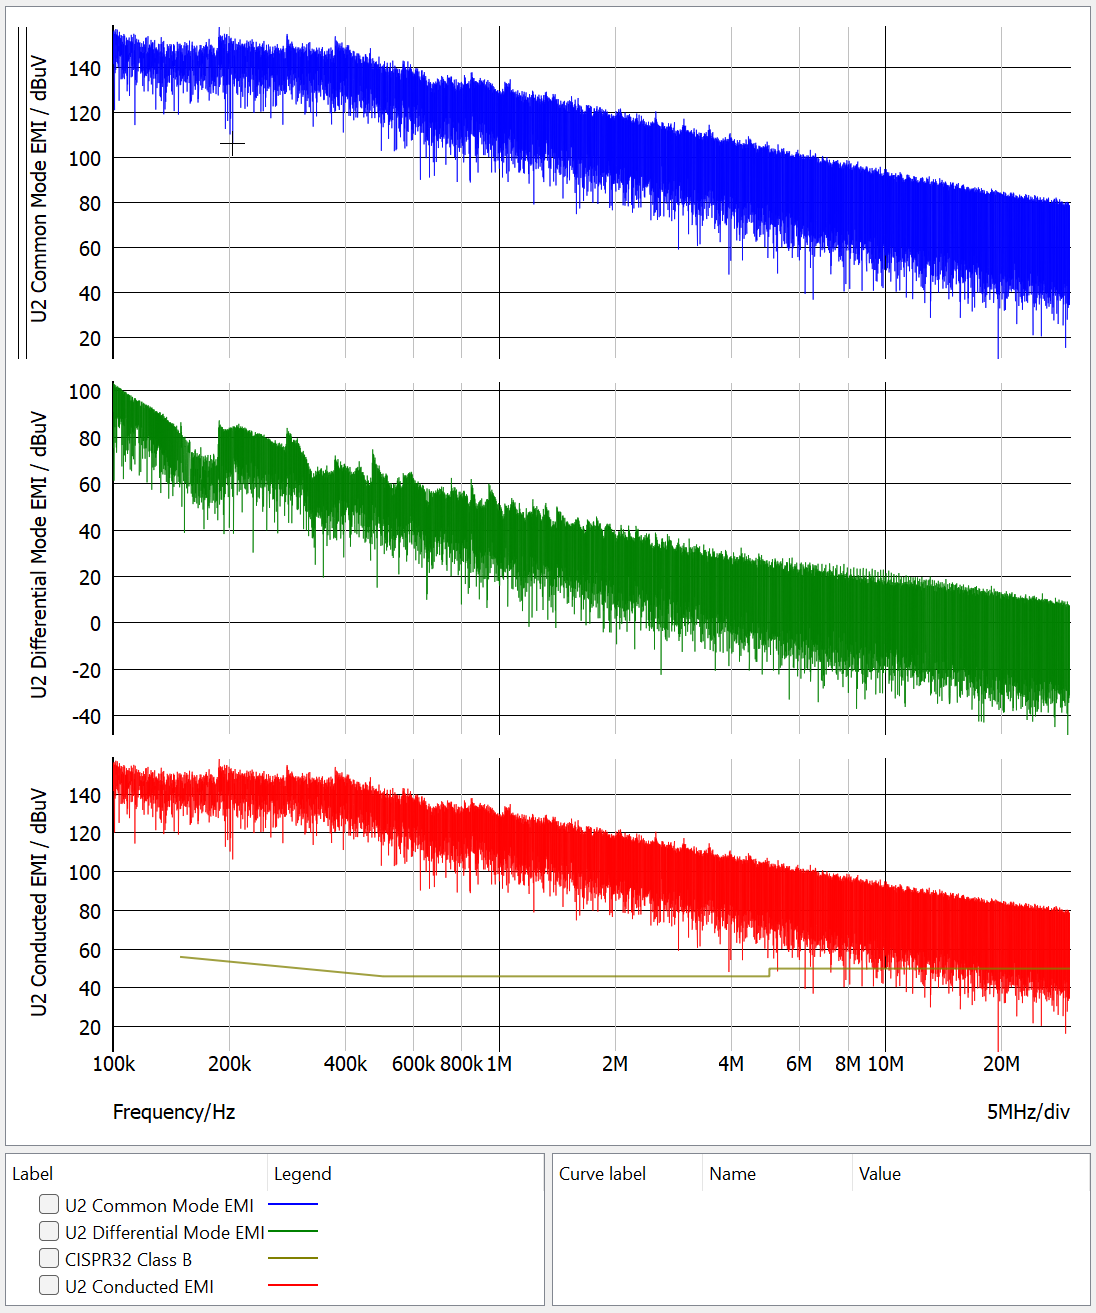
With the EMI Filter in place, the specification of the CISPR32 standard is met, as the measured EMI is below the specified limits:
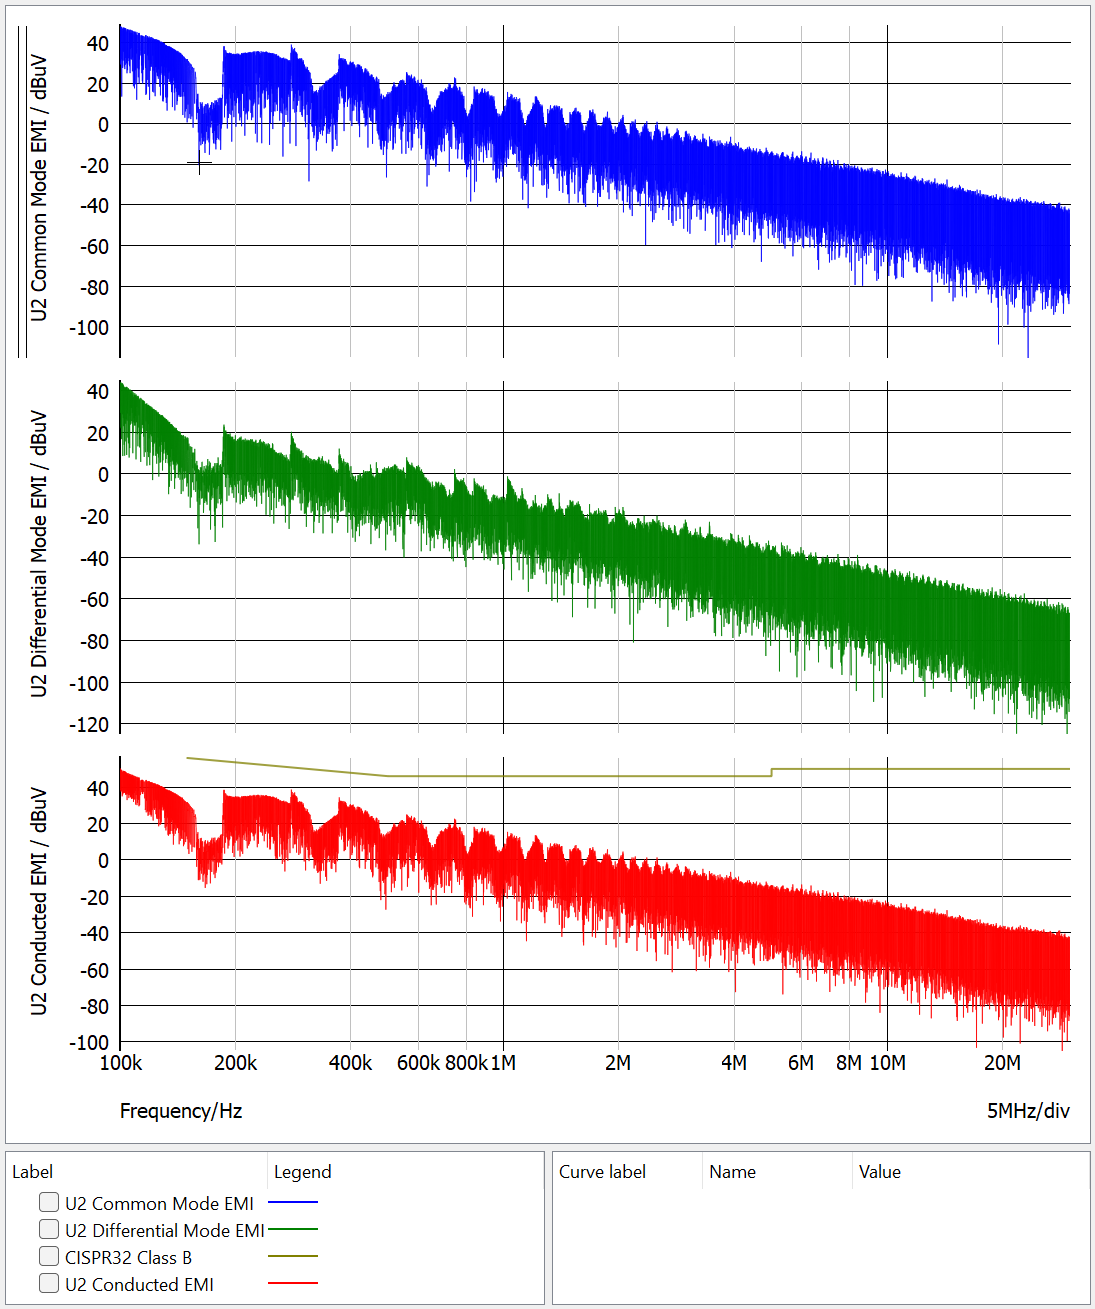
DC/DC Example: Automotive Application Buck Converter with EMI Filter and LISN
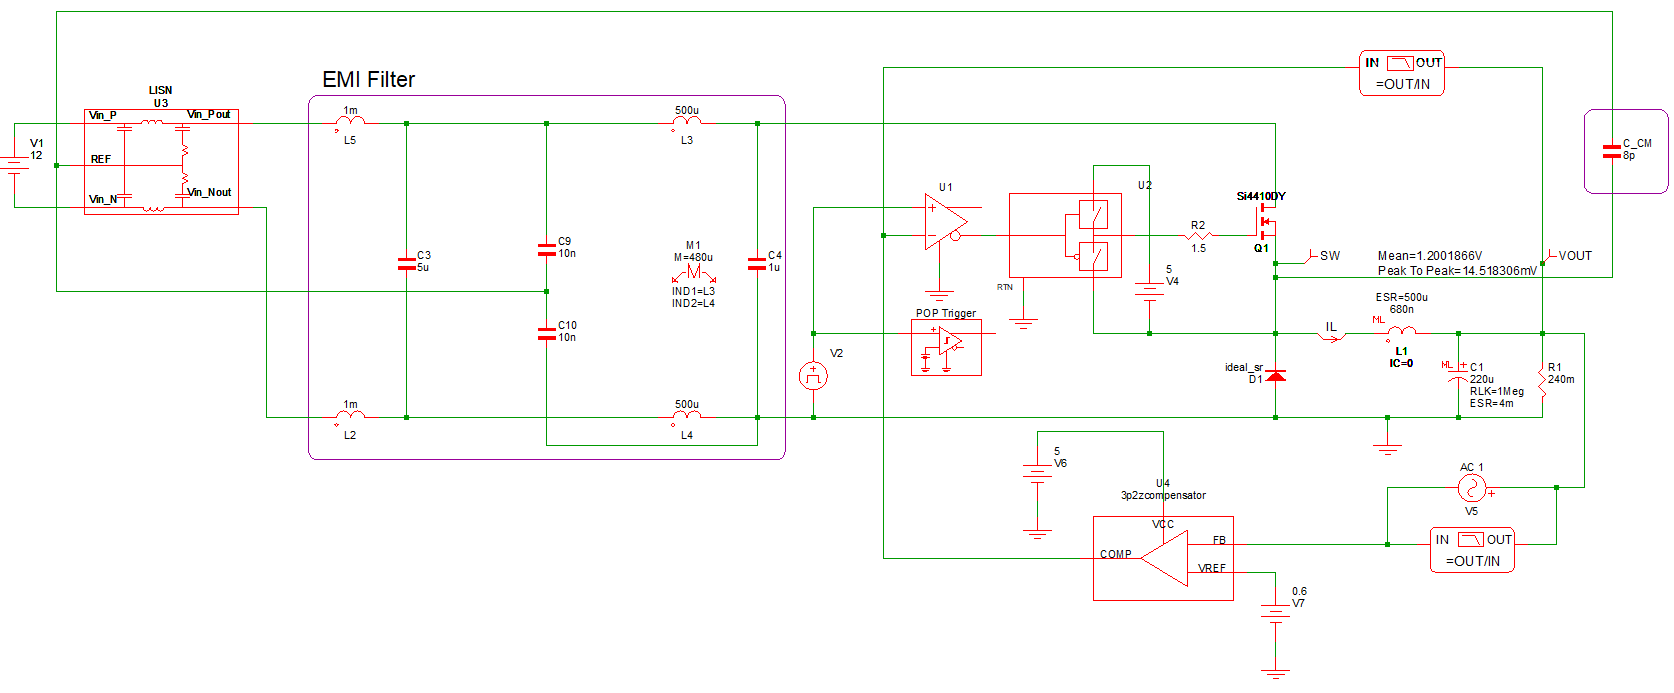
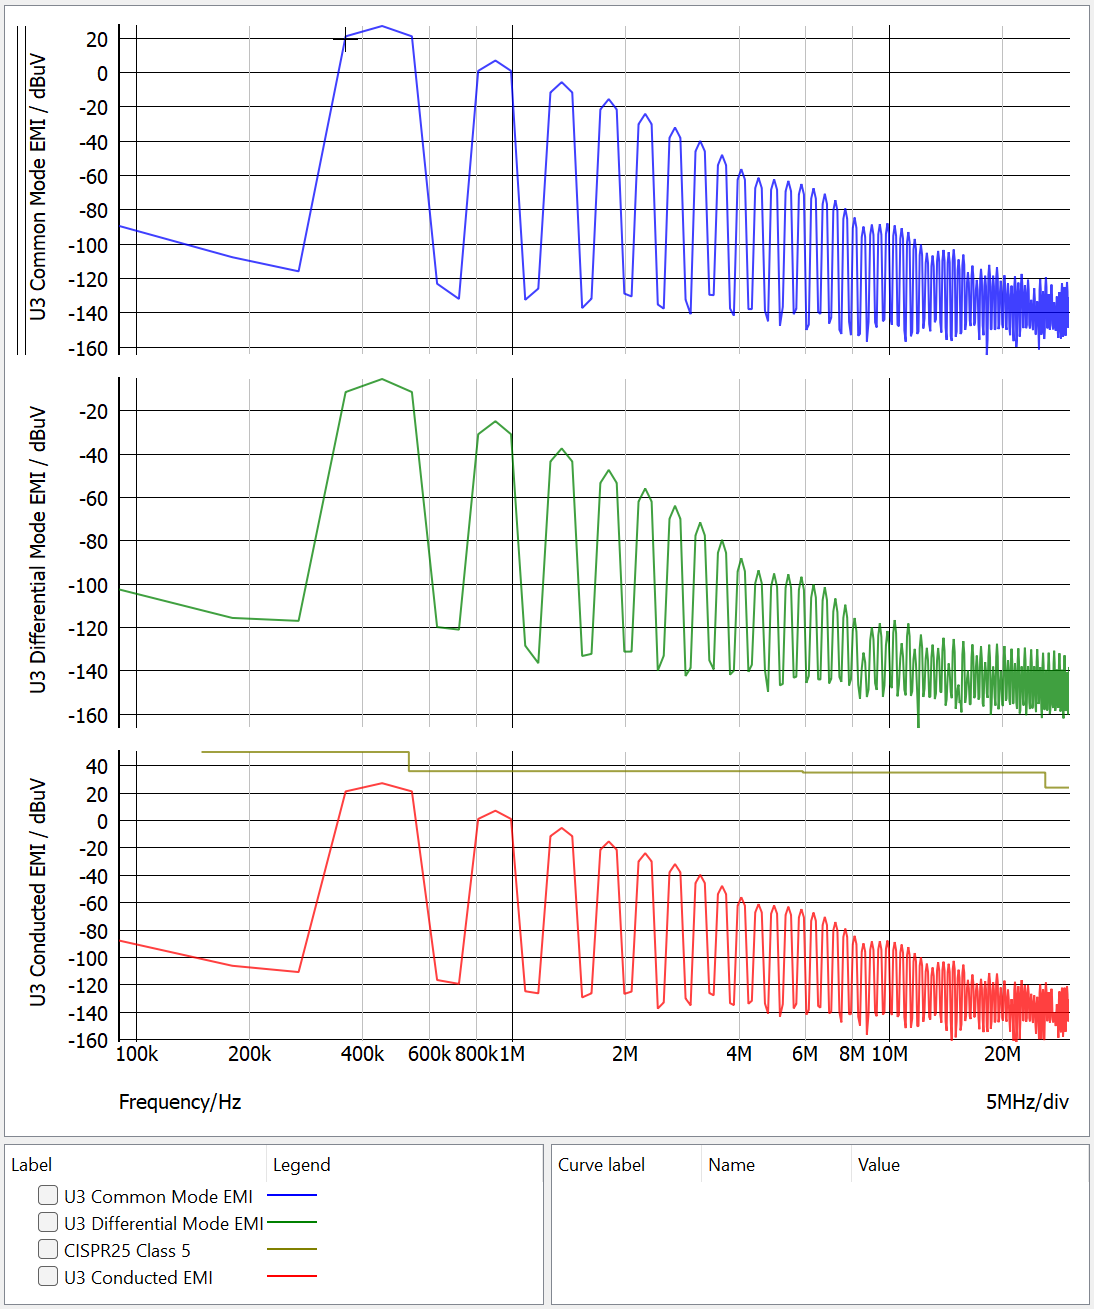
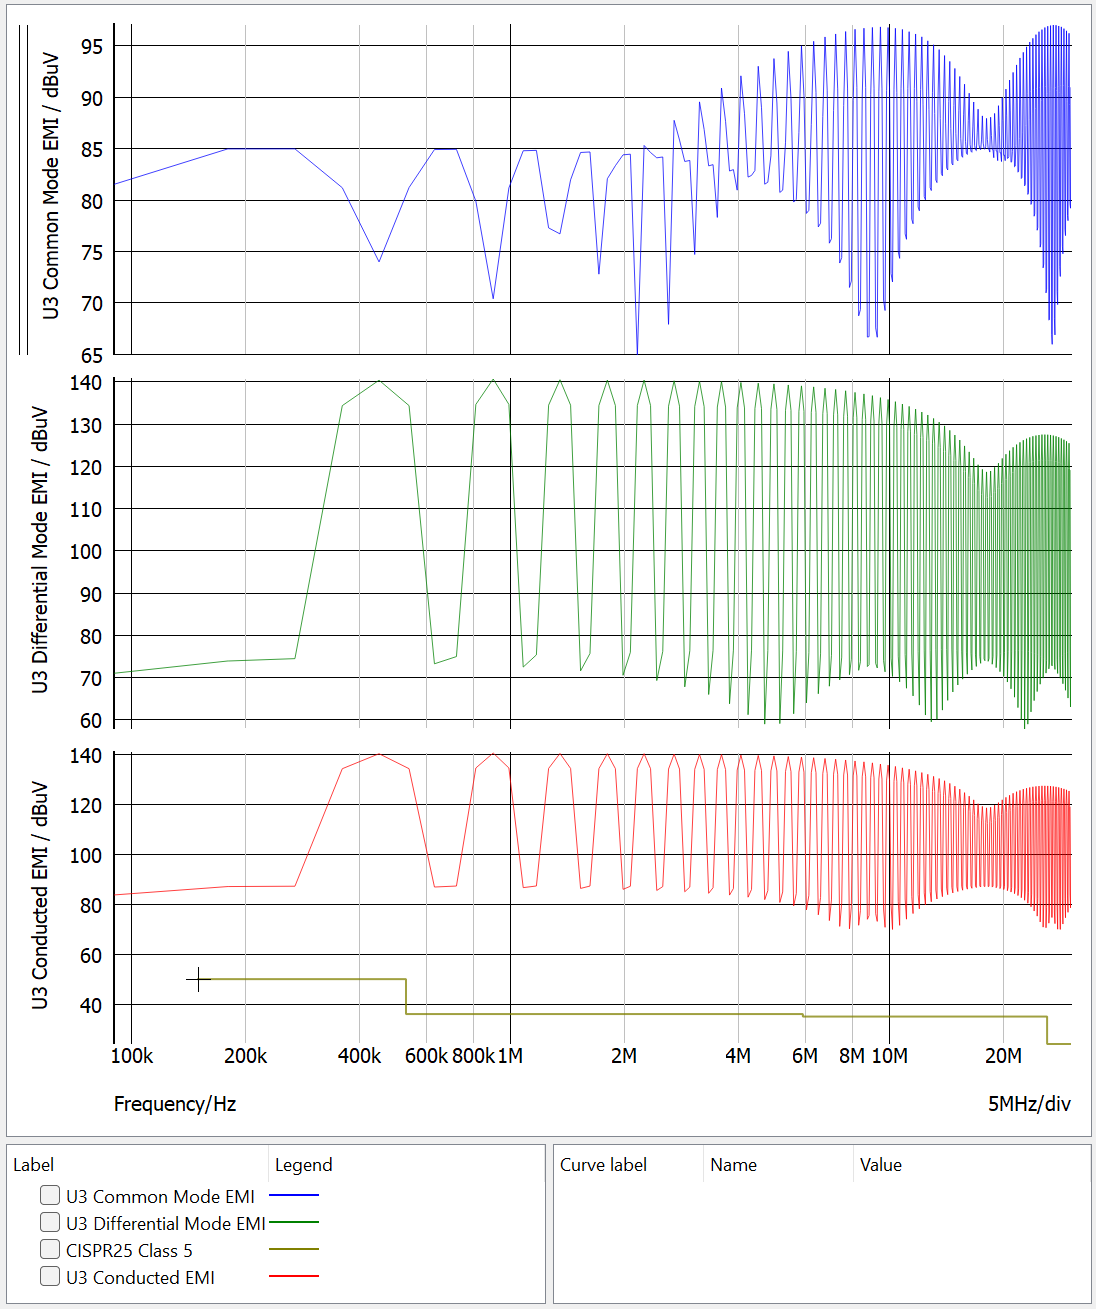
A buck converter for automotive applications powered by an automotive 12 V DC bus with a LISN and an EMI filter is provided in the schematic simplis_085_lisn_buck_converter.zip. The LISN is therefore configured to have a 5 µH inductor, and to show measured conducted EMI compared to a portion (up to 30 MHz) of the CISPR25 Class 5 standard for automotive electronics (the full standard specification extends beyond 30 MHz). Unlike the built-in standards which all show quasi-peak limits, this example uses an additional standard defined in the file CISPR25_Class5_Partial.csv showing peak emission limits. The schematic is configured to run a POP Analysis.
Waveforms
If the EMI filter is disabled or removed, the LISN will show that the conducted EMI exceeds the limits set by the CISPR25 Class 5 standard:
With the EMI Filter in place, the specification of the CISPR25 Class 5 standard is met, as the measured EMI is below the specified limits: