Running a Debug Session
To start a debug session, you first open the 'C' file in Visual studio, then set at least one breakpoint. Next you must attach the Visual Studio debugger to the SIMetrix simulator process which loads the 'C' file. Finally run the simulation until the breakpoint is hit. Here is the detailed procedure for Visual Studio 2022 and 2019. The procedure for older versions is similar but not identical.
- Start Visual Studio. The first time this is opened for a particular design, click on Open a local folder
- Navigate to the folder where the Verilog files are placed. This is C:\Users\[username]\AppData\Roaming\SIMetrix Technologies\SIMetrixnnn\cache\veriloga replace [username] with your login name and replace nnn with the SIMetrix version. E.g. 910 for version 9.1.
- Open the 'C' file relevant to the module you are debugging. This is always module_name.c where module_name is the name after the module statement in the Verilog-A code
-
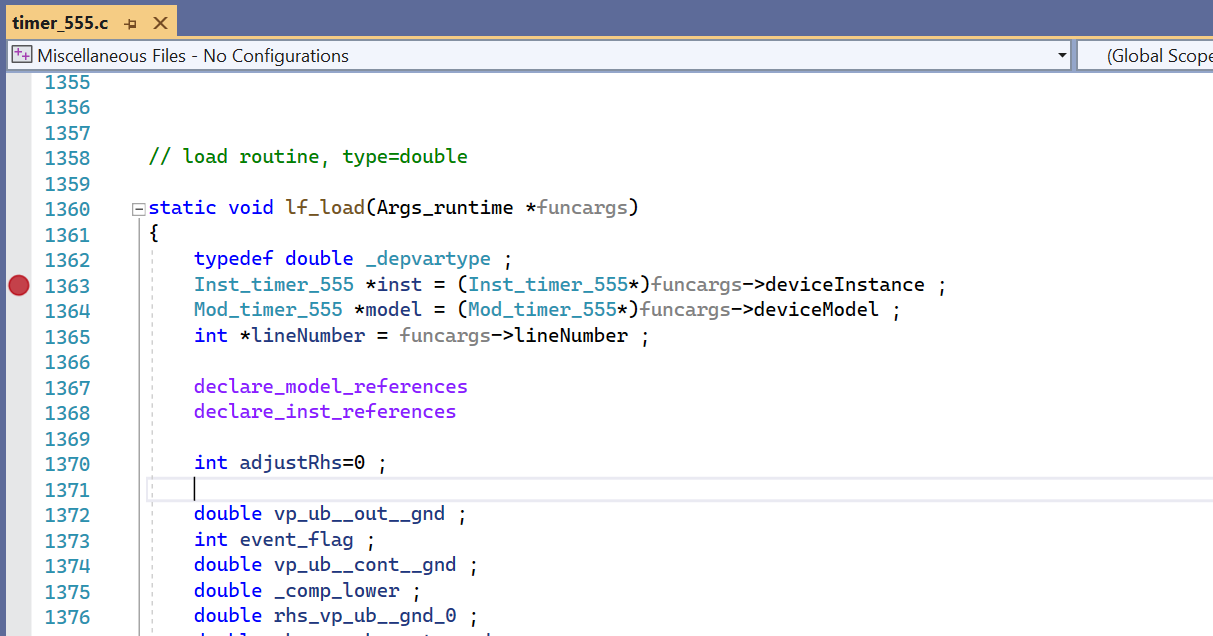
Set a breakpoint in the \texttt{lf_load} function. This is the function that is called to evaluate the device equations on each iteration. Depending on how shortcut keys are setup, this can usually be done with the F9 key. A red filled circle should appear on the left hand side, see picture below:
-
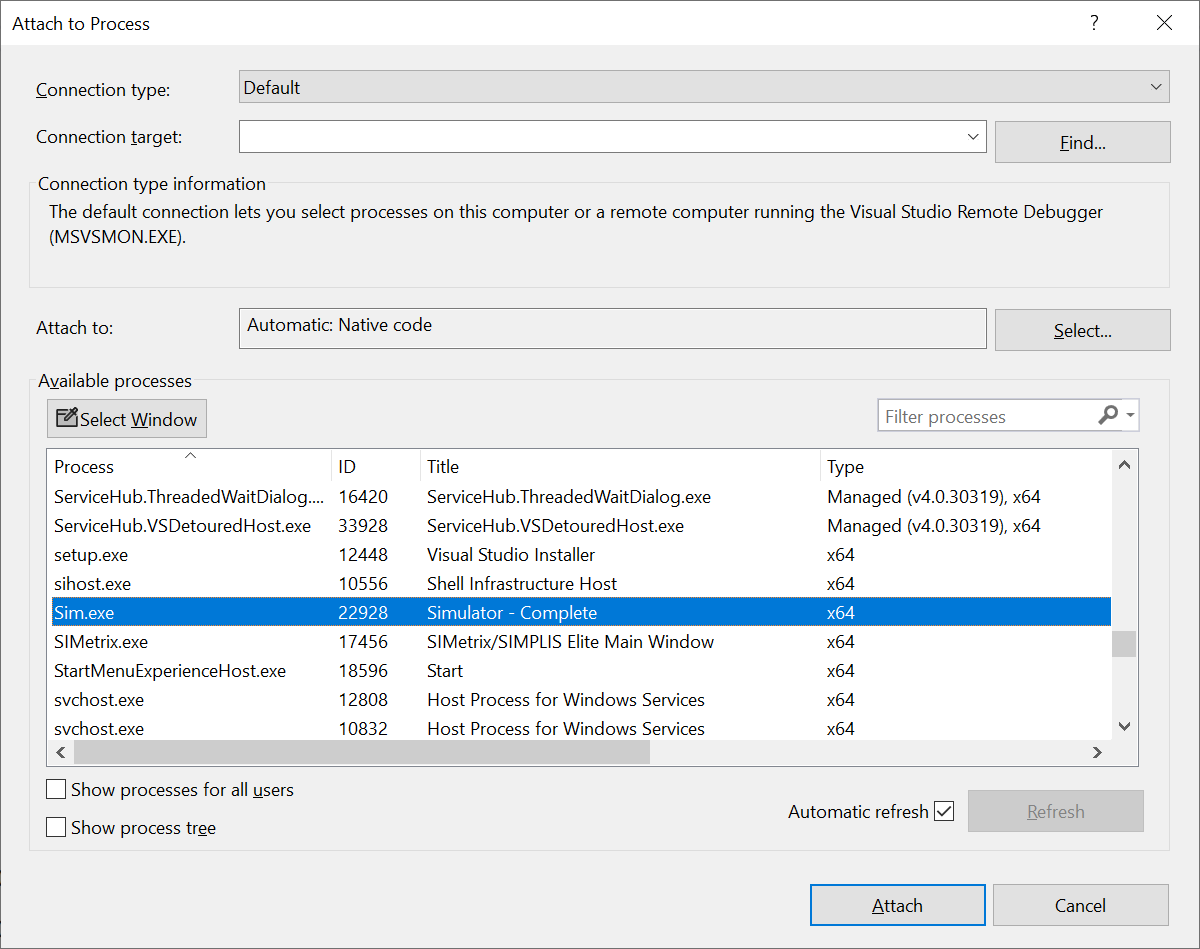
Select menu .
Navigate to SIM.exe in the Available processes window then click on Attach as shown below:
 Note the breakpoint marker after the process is attached. The image might change to a greyed image with an exclamation mark at the corner - see image below:
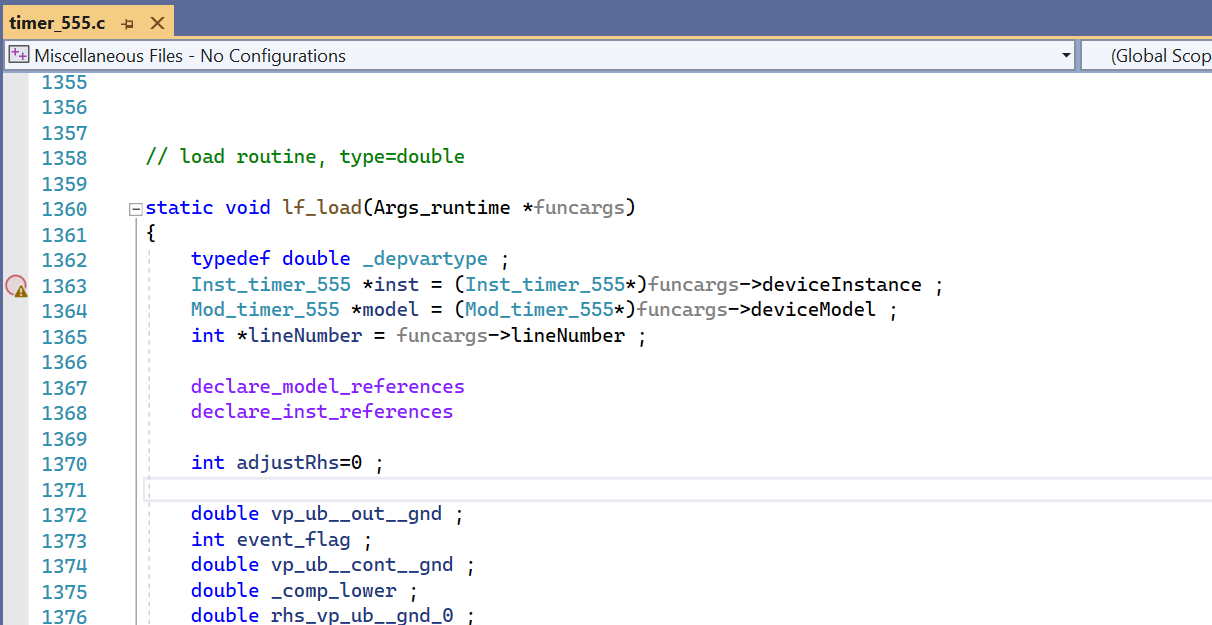 This means either that the Verilog-A compiled DLL (.sxdev file) is not loaded or it is loaded but was built from a different source file to the one displayed. This may not be a problem if, since running the simulation containing the Verilog-A file being studied, you ran another simulation on another circuit. Running another simulation will unload the .sxdev file from SIM.exe, but when a new simulation on the Verilog-A circuit is started, it will be reloaded. You should see the greyed circle change to a solid red circle when that happens.
- Run simulation
If all is well, the debugger will break at the breakpoint you set. You can now step through the code line by line and look at variable values etc. For more information, see Debugging Methods below.
| ◄ Preparation for Debug | Recompiling after Debugging ▶ |